Screenshots
Here you will find the main screens of the application to give you an idea of what it can do. Click a screenshot to maximize it.
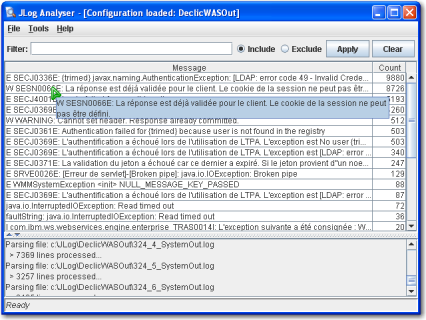
The main window
It shows all the messages/exceptions found in the logs, ordered by count. If you double-click a message, a Detail Dialog (see next screenshot) pops-up and displays the detail for this exception in all the log files collected.
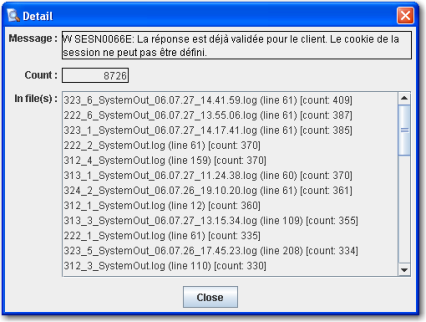
The detail window
This dialog displays the detail for one exception ordered by count. If you double-click a line in the list, the log file is opened in the configured text editor at the corresponding line.
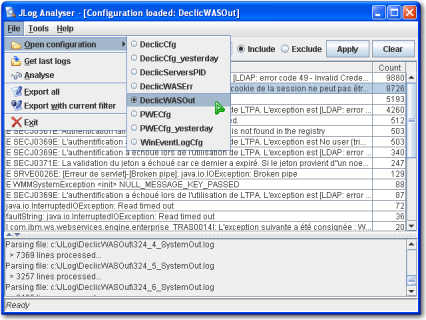
The options
This menu allows to open a configuration, download all the logs (via ftp), and export the analyse result in a tab seperated text file (this file can be directly opened with Microsoft Excel or similar).

The tools
This menu allows to customize JLog, to performe a custom search (looking for a string in all the logs downloaded) and merge all the exports to one file which gives all the messages counts for each report date. This allows you to monitor the exception count to see the evolution during time.